使用 Pprof 监控性能
Pprof 是 Go 的性能分析工具,可用于定位 CPU、内存等方面的瓶颈。它与 controller-runtime 的 HTTP 服务器集成,可通过 HTTP 端点进行分析;并可使用 go tool pprof 进行可视化。由于 Pprof 已内置在 controller-runtime 中,无需单独安装。借助 Manager 选项,你可以方便地启用 pprof 并收集运行时指标,以优化控制器性能。
如何使用 Pprof?
-
启用 Pprof
在
cmd/main.go中添加:mgr, err := ctrl.NewManager(ctrl.GetConfigOrDie(), ctrl.Options{ ... // PprofBindAddress is the TCP address that the controller should bind to // for serving pprof. Specify the manager address and the port that should be bind. PprofBindAddress: ":8082", ... }) -
试运行
启用 Pprof 后,构建并部署你的控制器进行验证。参考快速开始在本地或集群中运行你的项目。
随后应用你的 CR/示例以观察控制器的性能表现。
-
导出数据
使用
curl导出分析数据到文件:# 注意:这里使用的是在 cmd/main.go Manager 选项中配置的地址与端口 curl -s "http://127.0.0.1:8082/debug/pprof/profile" > ./cpu-profile.out -
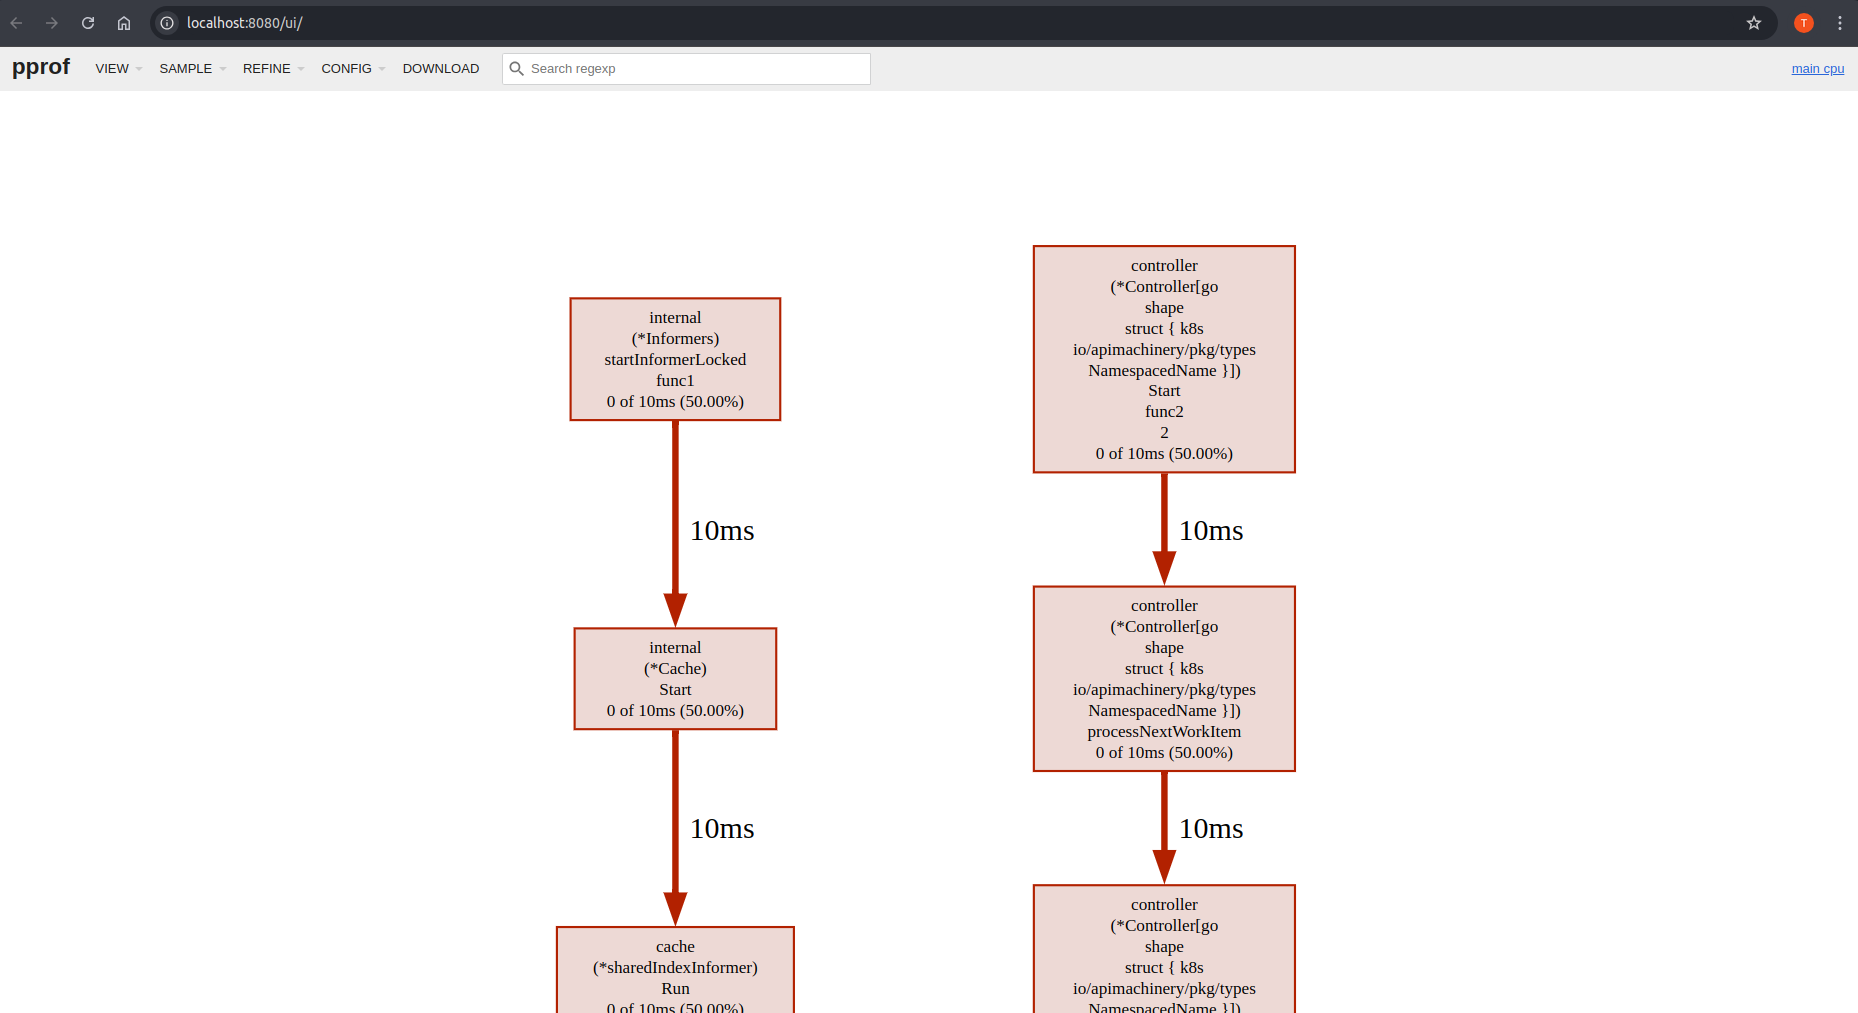
在浏览器中可视化结果
# Go 工具会在本地 8080 端口开启一个会话(可自定义端口)
go tool pprof -http=:8080 ./cpu-profile.out
可视化结果会随部署的工作负载与控制器行为而变化。你将看到类似如下的效果: